How to Read a Luminaire Light Distribution Curve?
Apr 14, 2026
A luminaire light distribution curve is a fundamental reference for lighting design and fixture selection. It not only defines how light is distributed in space, but also contains a range of key parameters. This article explains the concept of light distribution curve clearly from three aspects: definition, classification, and methods of representation.
1. What Is a Luminaire Light Distribution Curve?
A luminaire curve, also known as a luminous intensity distribution curve, describes how the light emitted by a fixture is distributed in different directions in space.
It provides detailed information such as total luminous flux, number of light sources, and power consumption, along with fixture dimensions, efficiency, manufacturer, and model details. Most importantly, it illustrates the intensity of light emitted at various angles.
These curves are typically obtained through professional testing in a dark room using specialized equipment, such as a goniophotometer. This testing method allows for an accurate analysis of a luminaire's light distribution characteristics, providing a reliable basis for lighting design and product selection.

2. Classification of Light Distribution Curves
Based on Spatial Angles and Luminous Intensity
The description of a luminaire's curve involves two key parameters. The first is the spatial angle centered on the luminaire, defined within a three-dimensional X/Y/Z coordinate system. The second is the luminous intensity at each angle.
By combining these two factors, the curves are plotted to show how intensity varies with direction. Common representations include polar diagrams and Cartesian (rectangular) plots, both of which visually reflect the characteristics of the light source. Together, they form the standard luminous intensity distribution diagrams used in lighting design.
Classification by Symmetry
The distribution curves can also be categorized based on their symmetry into three main types: axially symmetric, symmetric, and asymmetric distributions.
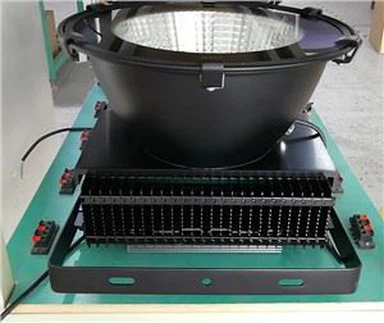
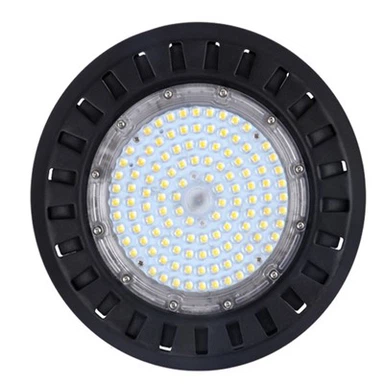
- Axially symmetric distribution (also known as rotational symmetry) means the light distribution remains essentially the same in all directions around the central axis. This type is commonly found in fixtures such as downlights and high bay lights.
- Symmetric distribution refers to luminaires whose light distribution is symmetrical in both the C0°–C180° plane and the C90°–C270° plane. This type is typical of linear lighting fixtures, such as LED T8 batten lights and LED panel lights, which exhibit balanced light output in opposite directions.
Asymmetric Distribution
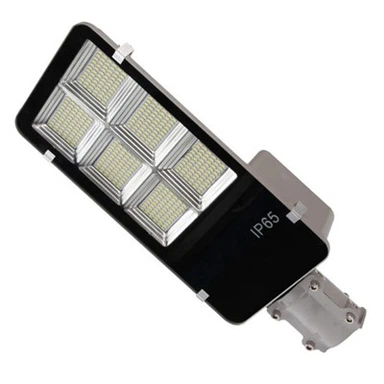
Asymmetric light distribution refers to cases where the luminous intensity is not symmetrical in either the C0°–C180° plane or the C90°–C270° plane (or both). This type of distribution is commonly found in directional lighting fixtures, such as certain floodlights designed for biased or targeted illumination.

Based on Beam Angle
Light distribution curves can also be classified according to beam angle into three general categories:
- Narrow distribution: beam angle less than 20°
- Medium distribution: beam angle between 20° and 40°
- Wide distribution: beam angle greater than 40°
It is worth noting that the exact definitions of these categories may vary slightly between manufacturers.
3. Methods of Describing Light Distribution Curves
Polar and Cartesian Diagrams
The curves are typically presented using either polar diagrams or Cartesian (rectangular) diagrams. These charts illustrate one or more cross-sections of the light output along the luminaire's optical axis.
If the light distribution is rotationally symmetric around the optical axis, a single cross-sectional curve is sufficient to fully describe it.
However, if the distribution exhibits bilateral symmetry, two perpendicular characteristic planes are required for accurate representation. For asymmetric light distributions, multiple cross-sectional curves must be used to clearly and comprehensively depict the light output.

Light Distribution Characteristics
In a polar diagram, the origin represents the center of the luminaire's emitting surface, while each concentric circle corresponds to a different level of luminous intensity. The outer circles indicate higher intensity than the inner ones. To interpret the diagram correctly, it is important to consider both the unit of luminous intensity and the actual light distribution.
In addition, the unit cd/1000 lm is often indicated in the diagram. This means the distribution is normalized per 1,000 lumens, so the actual luminous intensity must be converted accordingly when comparing different luminaires.
According to the annotations typically shown below the diagram, the T-curve represents the light distribution within the horizontal angle range of 0° to 180°, while the A-curve illustrates the distribution from 90° to 270°. Here, C denotes the horizontal plane angle.
Conclusion
The definition, classification, and description methods of light distribution curves together form the core knowledge for understanding how light is distributed from a luminaire. Mastering these concepts provides a scientific basis for lighting design and fixture selection, helping achieve more efficient and well-optimized lighting solutions.